Multiparametric AFM Imaging
Biological systems, ranging from single molecules to cells and tissues, have heterogeneous structural, biophysical and chemical properties that change dynamically to fulfill versatile functions. At the nanoscale, these properties determine how the highly sophisticated molecular machinery of the living cell works and responds to its complex environment. Hence, there is an urgent need for methods that can image native biological systems in physiological buffer and simultaneously map the systems’ multiple properties at molecular resolution.
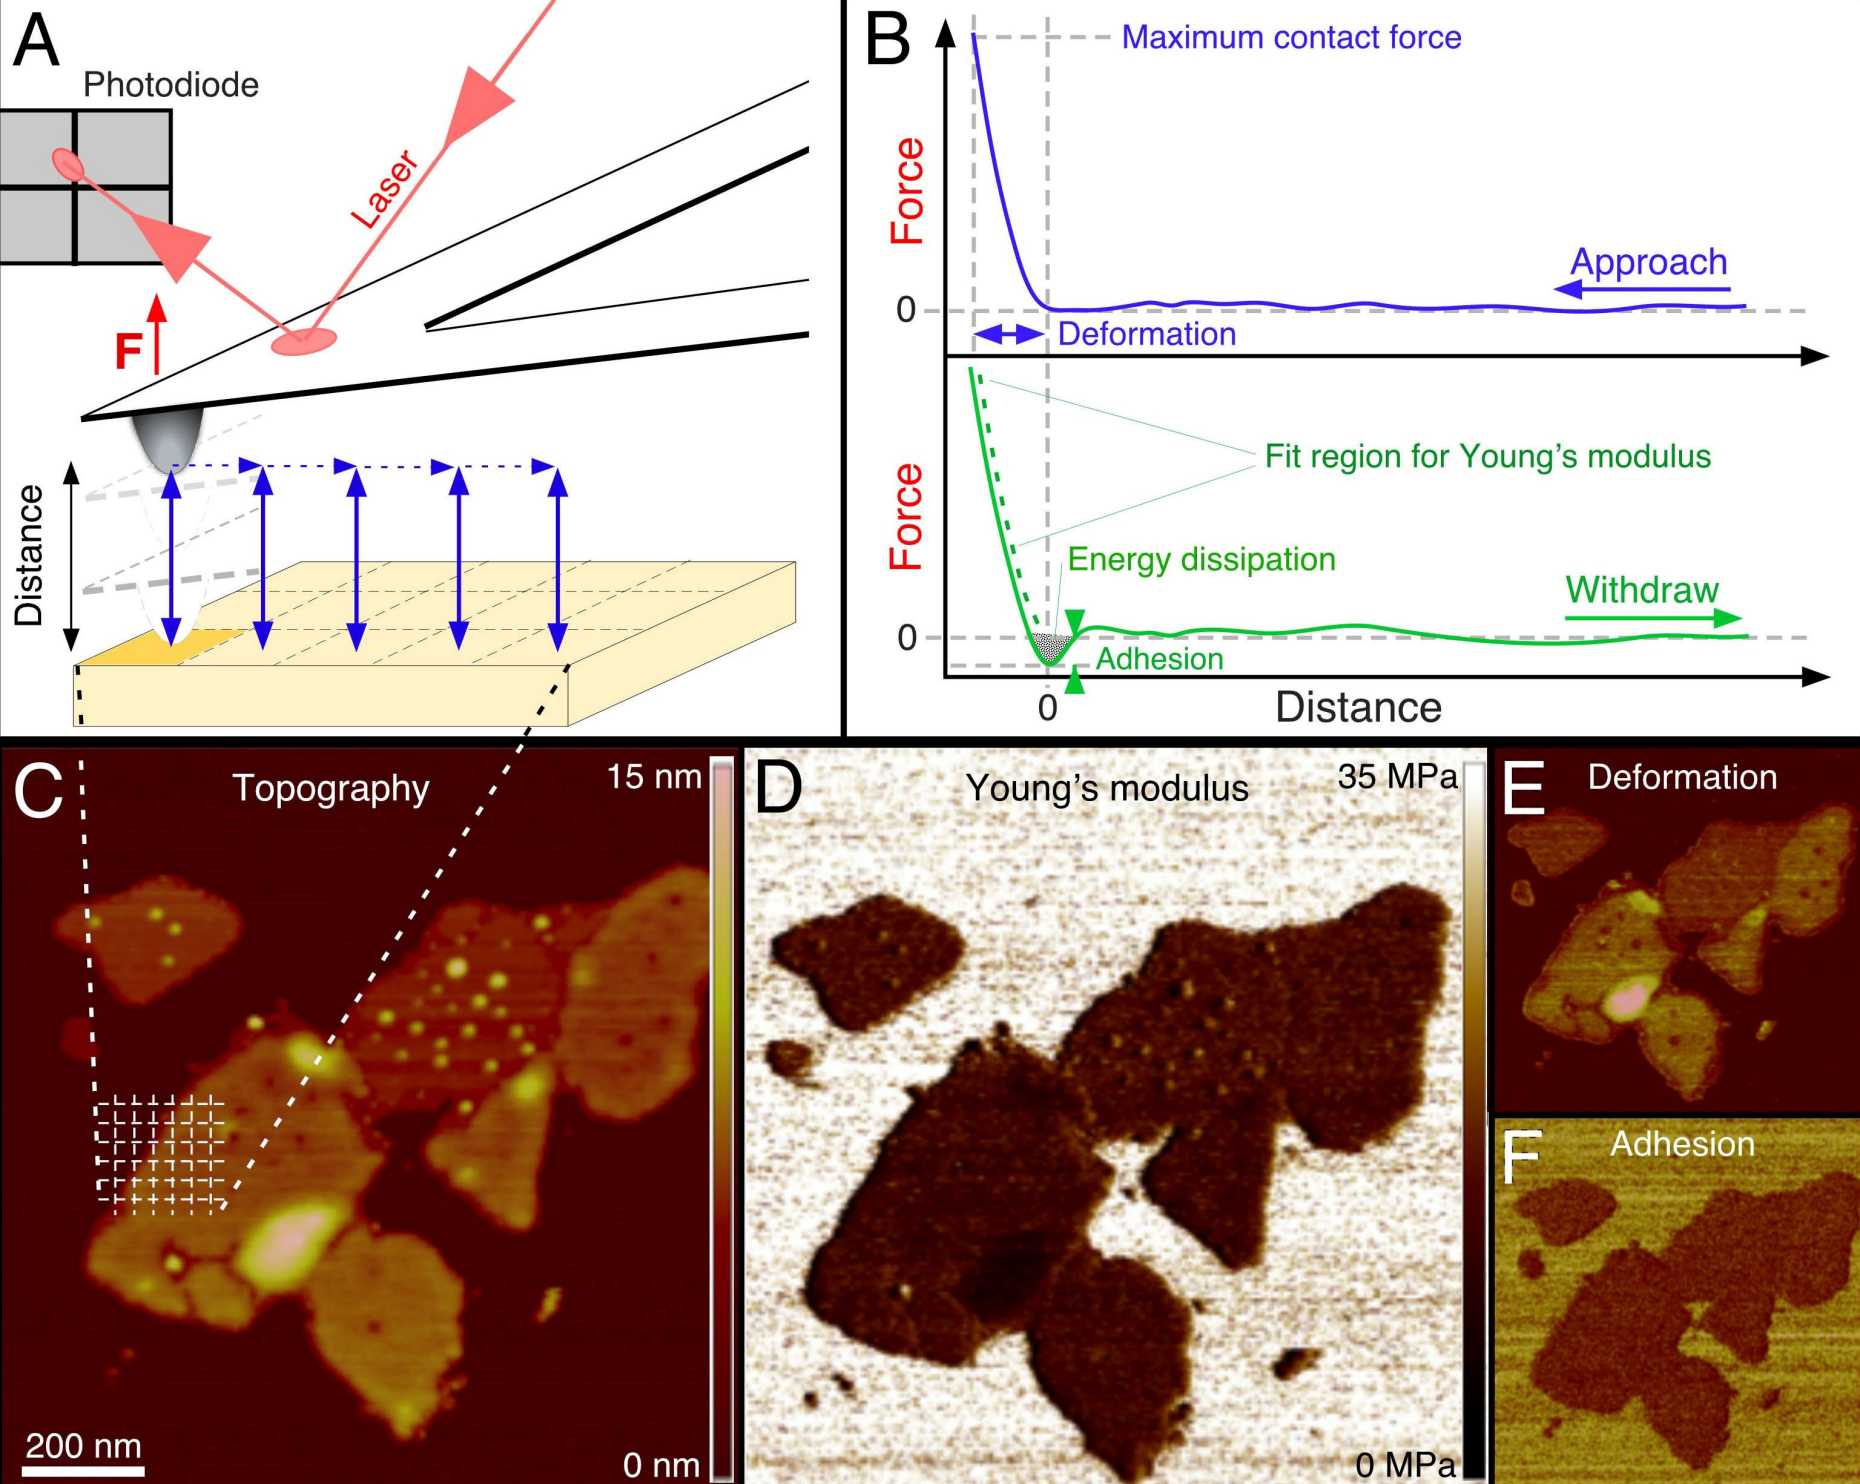
Developed over the past 15 years, force-distance curves-based AFM (FD curve–based AFM) imaging has now reached an exciting stage at which it can be used to image the architecture of complex biological systems such as living cells, model and cellular membranes, protein complexes, viruses and nucleic acids and at the same time quantify and structurally map their biophysical properties at nanometer resolution. To achieve this, an atomic force microscope is used to record an array of FD curves over the heterogeneous biological sample (Figure). For each FD curve, the microscope tip detects localized interactions with the sample at angstrom precision and piconewton sensitivity. These interactions are mapped pixel by pixel and are directly correlated to the topography of the biological sample. From this, a volume of interaction forces is reconstructed through which the probing tip moves on its way to the sample surface.
Because the tip can be physically, chemically or biologically functionalized, it resembles a molecular toolbox, allowing the interaction forces associated with a given property to be specifically selected and quantified. The method therefore offers a powerful approach for the quantitative three-dimensional (3D) imaging of the biological, chemical and physical properties of complex biosystems. Although powerful, FD-based AFM imaging has long been limited by poor spatial and temporal resolution, which are critical in biology, as cellular processes are highly dynamic and occur at the molecular scale. This drawback has severely hampered the widespread use of FD-based AFM in the life sciences. However, recent advancements in AFM technology circumvent these limitations and enable researchers to record quantitative 3D images of biological systems at molecular resolution and at the speed of conventional topographic AFM imaging. In our group we develop new methodlogical approaches and applications of FD-based AFM imaging towards improving our molecular understanding of the organization, mechanics and interactions of complex biological systems in relation to function.
Further reading
Atomic force microscopy imaging modalities in molecular and cell biology
Y.F. Dufrêne, T. Ando, R. Garcia, D. Alsteens, D. Martinez-Martin, A. Engel, C. Gerber & D.J. Müller
Nature Nanotechnology (2017) 12, 295-307.
Nanomechanical mapping of first binding steps of a virus to animal cells
D. Alsteens, R. Newton, R. Schubert, D. Martinez-Martin, M. Delguste, B. Roska & D.J. Muller
Nature Nanotechnology (2017) 12, 177-183.
Quantifying and identifying two ligand-binding sites while imaging native human membrane receptors by AFM
M. Pfreundschuh, D. Alsteens, R. Wieneke, C. Zhang, S.R. Coughlin, R. Tampé, B.K. Kobilka & D.J. Müller
Nature Communications (2015) 6, 8857. external pageonline
Directly observing the lipid-dependent self-assembly and pore-forming mechanism of the cytolytic toxin listeriolysin O
E. Mulvihill, K. van Pee, S.A. Mari, D.J. Müller & Ö. Yildiz
Nano Letters (2015) 15, 6965-6973 external pageonline
Imaging G protein-coupled receptors while quantifying their ligand-binding free-energy landscape
D. Alsteens, M. Pfreundschuh, C. Zhang, P. Spoerri, S.R. Coughlin, B.K. Kobilka & D.J. Müller
Nature Methods (2015) 12, 845-851.
Localizing chemical groups while imaging single native proteins by high-resolution AFM
M. Pfreundschuh, D. Alsteens, M. Hilbert, M.O. Steinmetz & D.J. Müller
Nano Letters (2014) 14, 2957-2964.
Multiparametric high-resolution imaging of native proteins by force-distance curve– based AFM
M. Pfreundschuh, D. Martinez-Martin, E. Mulvihill, S. Wegmann & D.J. Muller
Nature Protocols (2014) 9, 1113-1130.
Quantitative imaging of the electrostatic field and potential generated by a transmembrane protein at sub-nanometer resolution
M. Pfreundschuh, U. Hensen & D.J. Müller
Nano Letters (2013) 13, 5585-5593.
Multi-parametric imaging of biological systems by force-distance curve-based AFM
Y.F. Dufrene, D. Martínez-Martín, I. Medalsy, D. Alsteens & D.J. Muller
Nature Methods (2013) 10, 847-854.
The fuzzy coat of pathological human Tau fibrils is a polyelectrolyte polymer brush
S. Wegmann, I. Medalsy, E. Mandelkow & D.J. Muller
Proc. Natl. Acad. Sci. USA (2013) 110, E313-321.
Nanomechanical properties of proteins and membranes depend on loading rate and electrostatic interactions
I. Medalsy & D.J. Muller
ACS NANO (2013) 7, 2642-2650.
Quantifying chemical and physical properties of native membrane proteins at molecular resolution by force-volume AFM
I. Medalsy, U. Hensen & D.J. Muller
Angewandte Chemie International Edition (2011) 50,12103-12108.